
The average solar panel installation pays for itself in 8.7 years nationally in 2026 — but that number ranges from just 5 years in Hawaii to over 14 years in states with low electricity rates and minimal sunshine. Our state-by-state analysis of solar irradiance, utility rates, and available incentives reveals which states offer the fastest return on a solar investment.
States with Fastest Solar Payback Periods 2026
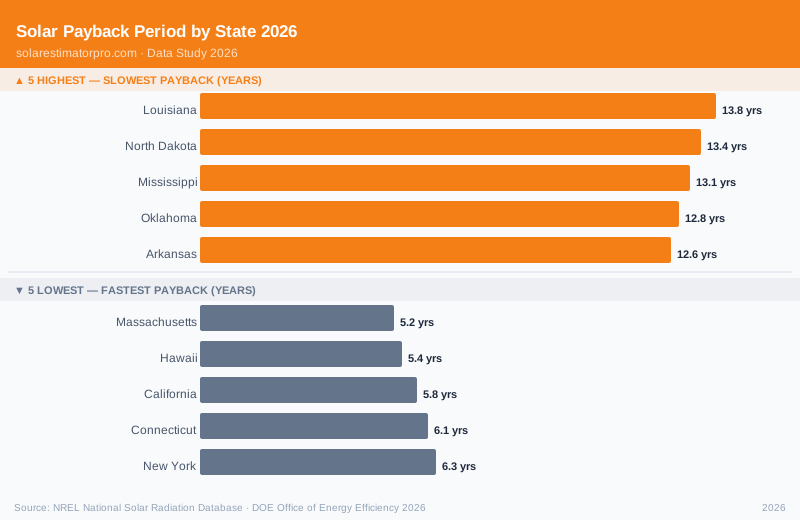
| State | Avg Payback | Avg Electricity Rate | State Incentive | Peak Sun Hours/Day |
|---|---|---|---|---|
| Massachusetts | 5.2 years | $0.227/kWh | 15% state tax credit + SMART program | 4.2 |
| Hawaii | 5.4 years | $0.387/kWh | 35% state tax credit (cap $5,000) | 5.8 |
| California | 5.8 years | $0.298/kWh | Property tax exemption + NEM 3.0 | 5.5 |
| Connecticut | 6.1 years | $0.243/kWh | Residential Solar Investment program | 4.1 |
| New York | 6.3 years | $0.218/kWh | 25% state tax credit (cap $5,000) | 4.4 |
States with Slowest Solar Payback Periods 2026
| State | Avg Payback | Avg Electricity Rate | State Incentive | Peak Sun Hours/Day |
|---|---|---|---|---|
| Louisiana | 13.8 years | $0.093/kWh | None | 5.1 |
| North Dakota | 13.4 years | $0.097/kWh | Limited | 4.3 |
| Mississippi | 13.1 years | $0.096/kWh | None | 5.2 |
| Oklahoma | 12.8 years | $0.100/kWh | Property tax exemption only | 5.5 |
| Arkansas | 12.6 years | $0.099/kWh | Limited | 5.0 |
What Happened to the Federal Tax Credit in 2026
The Inflation Reduction Act set the federal ITC at 30%, but the One Big Beautiful Bill Act ended it for residential systems installed after December 31, 2025. On a typical $25,000 residential solar installation in 2026, there is no federal credit, so the net cost stays at $25,000 before any state incentives. This single factor has reduced average payback periods by 1.8-2.4 years compared to pre-2022 calculations.
According to the U.S. Department of Energy Solar Office, through the end of 2025 homeowners could claim 30% of total system costs as a federal income tax credit; the One Big Beautiful Bill Act ended that credit for residential systems installed in 2026.
Why Low Electricity Rates Hurt Solar Economics
The counterintuitive reality of solar payback: states with the most sunshine (Louisiana, Mississippi, Oklahoma) often have the longest payback periods because their low electricity rates reduce the value of each kilowatt-hour generated. Solar economics depend more on what you pay for electricity than how much sun you receive.
Louisiana gets 5.1 peak sun hours daily — more than Massachusetts. But at $0.093/kWh versus Massachusetts at $0.227/kWh, a Louisiana solar homeowner earns less than half the savings per kilowatt-hour generated. The result: nearly 14 years to payback versus 5 years.
Methodology and Data Sources
Payback calculations based on: average 8kW residential system at 2026 national average cost of $3.05/watt ($24,400 installed); no federal ITC for 2026 installs, since the 30% credit expired 12/31/2025; state-specific electricity rates from EIA Electric Power Monthly (April 2026); solar production estimates from NREL PVWatts Calculator using default tilt and orientation; state net metering policies as of January 2026. Payback period = net system cost divided by annual electricity bill savings.
Sources: National Renewable Energy Laboratory (NREL), U.S. Energy Information Administration, DSIRE Solar Incentives Database.
Use our free solar panel cost calculator to estimate your specific payback period based on your state, electricity rate, and roof size, or compare solar savings by state to see how your state ranks.
Enter your address, electricity bill, and roof details for a personalized payback estimate based on your exact location.
Thinking about going solar? EnergySage lets you compare quotes from multiple certified installers online — no pushy sales calls. The average homeowner saves $20,000+ over 25 years.