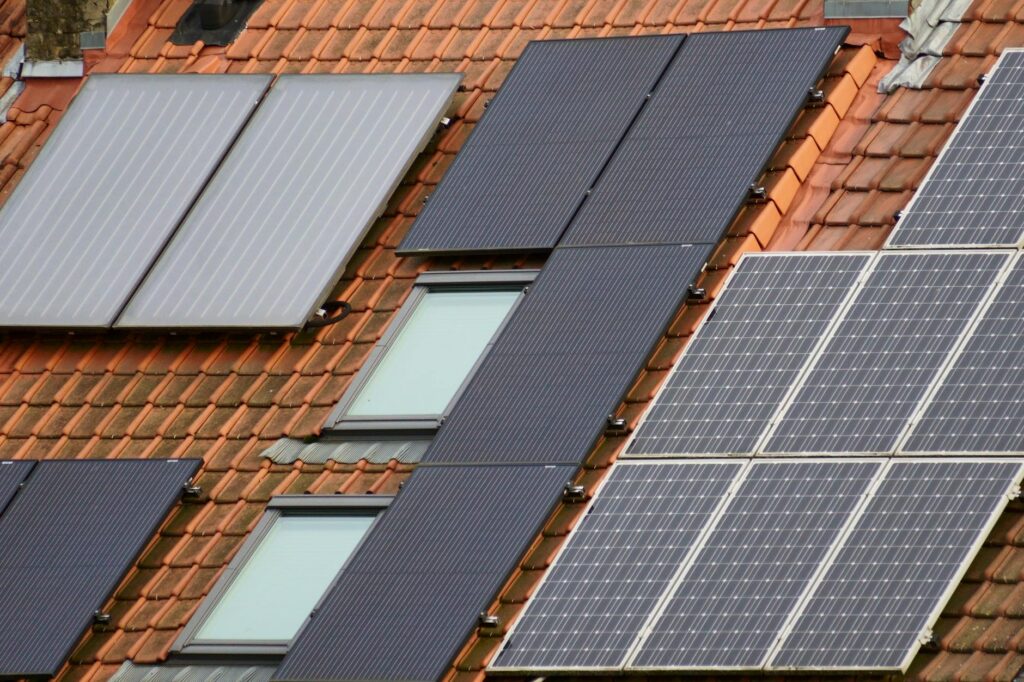
Solar energy savings are no longer a distant promise reserved for early adopters. In 2026, millions of American homeowners are weighing whether going solar still makes financial sense — and for many, especially in high-electricity-rate states, it does. With utility rates climbing and installation costs near historic lows, the math often works. But it changed in one important way this year: the federal tax credit that used to cut thousands off an owned system expired at the end of 2025. This guide breaks down what you can actually save in 2026, with real numbers and the current rules.
What Drives Solar Energy Savings in 2026
The average American household spent about $1,526 on electricity in 2025, according to the U.S. Energy Information Administration — a figure that continues to rise roughly 3 to 5 percent a year. At the same time, the average residential solar installation costs between $15,000 and $25,000 before incentives, down from nearly $40,000 a decade ago. Those two trends — rising grid prices and falling install costs — are what make solar savings real.
The federal picture shifted in 2026. The 30% Residential Clean Energy Credit (Section 25D) that homeowners relied on for years expired on December 31, 2025 under the One Big Beautiful Bill Act. A homeowner who buys a system with cash or a loan in 2026 receives no federal tax credit. Two things still help: if your system was placed in service in 2025, §25D still applies on your 2025 federal return; and if you go solar through a lease or PPA, the financing company claims a 30% credit under Section 48E and passes the savings to you as a lower payment. State incentives, utility rebates, and net metering — covered below — are now the primary ways to cut your out-of-pocket cost. For the full breakdown, see our guide on the federal solar tax credit in 2026.
Breaking Down the Numbers: What Does Solar Actually Save You?
How much you save depends on several factors: your current electricity usage, your local utility rates, the size of your solar system, and how much sunlight your roof receives. A typical American home uses about 10,500 kilowatt-hours (kWh) of electricity per year. A properly sized solar system — usually between 6 kW and 10 kW — can offset 70 to 100 percent of that usage. At a national average electricity rate of about $0.16 per kWh, that translates to annual savings of roughly $1,100 to $1,680. Over 20 years, accounting for rising utility rates, many homeowners accumulate $30,000 to $50,000 in lifetime electricity savings.
Payback periods, however, are longer in 2026 than the headlines of recent years suggested, because the federal credit no longer reduces an owned system’s cost. For a cash or loan purchase, the national payback period now sits around 10 to 16 years, with high-rate, high-sun states like California, Hawaii, and Massachusetts closer to 8 to 11 years and low-rate states stretching to 16 years or more. After that break-even point, every kilowatt-hour your panels produce is essentially free money in your pocket. A lease or PPA shifts this math: no upfront cost and immediate monthly savings, but you do not own the system or capture its full long-term value.
Net Metering: The Savings Multiplier Most Homeowners Overlook
One of the most underappreciated drivers of solar energy savings is net metering. When your solar panels produce more electricity than your home consumes — which commonly happens on sunny afternoons — the excess power flows back into the grid, and your utility credits your account, effectively running your meter backward.
In states with full retail net metering, you receive credit at the same rate you would otherwise pay for electricity. If your panels generate 500 kWh more than you use in a given month and your electricity rate is $0.18/kWh, you earn a $90 credit on your next bill. Over a full year, strong net metering can reduce your electricity bill to near zero — or even generate a small credit balance.
It is worth noting that net metering policies vary significantly by state and utility. California’s NEM 3.0 policy, for example, altered export rates for new customers. Always verify your local net metering rules before sizing your system, as this directly affects your projected savings timeline. See how net metering works and how much you can earn.
Solar Savings by State: Location Changes Everything
Your zip code plays an enormous role in determining your solar energy savings. The same 8 kW system installed in Phoenix, Arizona generates roughly 13,000 kWh per year. Install that same system in Seattle, Washington, and you are looking at closer to 8,000 kWh annually — a 38 percent difference in output simply due to climate.
High electricity rates can partially compensate for lower sun exposure. Massachusetts, for example, has some of the highest utility rates in the country, over $0.25/kWh. Even with less sun than the Southwest, Massachusetts homeowners often achieve excellent savings because every kWh they generate offsets a more expensive grid kilowatt. Meanwhile, states like Louisiana and Oklahoma have low electricity rates but abundant sunshine — a different savings equation entirely.
The combination of sun hours, electricity rates, available incentives, and local installer competition all feed into a personalized savings estimate that no national average can capture. That is precisely why a location-specific calculation matters so much before you commit.
Use Our Free Solar Savings Calculator
With solar incentives, utility rates, and installation costs all shifting in 2026, guessing your savings is a gamble you do not need to take. Visit solarestimatorpro.com and use our free solar savings calculator to get a complete, personalized financial picture in under two minutes. Enter your address, average monthly electric bill, and roof details, and the tool outputs your estimated annual dollar savings, your projected payback period in years, the percentage of your electricity bill solar can offset, and a side-by-side comparison of staying on grid power versus going solar over 10, 20, and 25 years — all using current 2026 rules.
Don’t rely on a sales rep’s estimate or a generic online average. Get numbers built specifically around your home, your utility provider, and your energy usage before installation prices shift again.
Frequently Asked Questions
How much does the average homeowner save with solar panels per year?
Most American homeowners save between $1,100 and $1,680 per year after going solar, based on average electricity usage of 10,500 kWh and a national average rate of around $0.16 per kWh. Homeowners in states with higher electricity rates — such as Massachusetts, Connecticut, or California — can see annual savings well above $2,000. Your exact figure depends on system size, local rates, and how much sunlight your roof receives.
How long does it take for solar panels to pay for themselves in 2026?
For a cash or loan purchase in 2026, the average payback period is roughly 10 to 16 years, longer than in past years because the 30% federal tax credit no longer applies to owned systems. Homeowners in high-electricity-cost or sun-heavy states like California, Hawaii, and Massachusetts can see payback closer to 8 to 11 years, while low-rate states can stretch to 16 years or more. A lease or PPA has little or no payback period since there is no upfront cost. After break-even, your system continues generating low-cost electricity for another 10 to 20 years.
Is there still a 30% federal solar tax credit in 2026?
Not for homeowners who buy their system with cash or a loan. The 30% Residential Clean Energy Credit (Section 25D) expired on December 31, 2025 under the One Big Beautiful Bill Act, with no phase-down. If you installed in 2025, you can still claim the credit on your 2025 tax return. In 2026, the credit survives only through third-party ownership: with a lease or PPA, the financing company claims a 30% credit under Section 48E (available through 2027) and passes the benefit to you as a lower monthly payment.
What is net metering and how does it boost my solar savings?
Net metering is a billing arrangement where your utility credits you for excess solar electricity you send back to the grid. If your panels generate more power than you use on a sunny day, those credits offset the electricity you draw at night or on cloudy days. In states with full retail net metering, this mechanism can reduce your annual electricity bill to near zero.
Do solar panels increase home resale value?
Yes. Multiple studies, including research from Lawrence Berkeley National Laboratory, show that homes with owned solar installations sell for an average of 3 to 4 percent more than comparable non-solar homes. On a $400,000 home, that is an additional $12,000 to $16,000 in resale value. The boost is most significant in states with high electricity rates and strong solar markets. Leased systems generally do not add the same value.
Conclusion
Solar energy savings in 2026 are still substantial in many markets, even though the federal tax credit no longer reduces the cost of an owned system. With installation costs near their lowest in decades and electricity rates continuing to climb, the financial case for going solar remains compelling for a large share of American homeowners — particularly in high-rate states. The payback math is longer and more location-dependent than it was a year ago, so the key is getting accurate numbers tied to your specific situation: your utility rates, your sun exposure, and the state and utility incentives you actually qualify for. Start with the data, make a confident decision, and let your roof work for your wallet for the next 25 years.